Quick take
Ashok Leyland Ltd
BUY
Scrappage policy to drive faster growth
CMP
`139
Target Price
`163
Ashok Leyland Ltd (ALL) is the flagship company of the Hinduja Group, and one of the
Investment Period
12 Months
largest commercial vehicle manufacturers in India. ALL is engaged in the
manufacturing of commercial vehicles and related components. ALL’s products include
Stock Info
buses, trucks, engines, defense and special vehicles. Ashok Leyland offers a range of
Sector
Commercial Vehicles
products from 18 to 82 seater double-decker buses, from 7.5 to 49 tonne in haulage
Market Cap (` cr)
41,009
vehicles, from numerous special application vehicles to diesel engines for industrial,
Net Debt (` cr)
1,411
marine and genset applications. The company is headquartered in Chennai, India.
Beta
1.1
The company’s manufacturing facilities are spread across India with two facilities in
52 Week High / Low
144/81
Avg. Daily Volume
1,165,131
Prague (Czech Republic) and Ras Al Khaimah (UAE). It has operations in India, Sri
Face Value (`)
1
Lanka, Bangladesh, Mauritius, the Middle East and Africa.
BSE Sensex
33,317
Vehicle scrappage policy to trigger ALL’s growth: The government has introduced
Nifty
10,249
vehicle scrappage policy for commercial vehicles older than 15 years of age. The
Reuters Code
ASOK.BO
ministry is considering to incentivise fleet operators for scrapping old vehicles in the
Bloomberg Code
AL.IN
form of reduced tax rate on new vehicles. However, the quantum of concessions to be
offered for scrapping the old vehicles is in the process of finalisation and is expected to
Shareholding Pattern (%)
be out soon. As per the draft report, about 11 lakh MHCVs would qualify for
Promoters
51.3
scrappage, which provides huge opportunity for the industry (current industry size of 4
MF / Banks / Indian Fls
11.4
lakh units). ALL is leading MHCV player and in our view, ALL is set to capture the
FII / NRIs / OCBs
25.2
additional growth opportunity going ahead.
Indian Public / Others
12.1
Strong growth momentum in LCV business: Post GST rollout, LCV demand is picking
up strongly due to consolidation of warehouses (hub and spoke model). Moreover,
Abs.(%)
3m
1yr
3yr
Sensex
2.9
16.2
14.6
improved rural demand coupled with boom in e-commerce will drive LCV demand.
ALL
91.5
22.7
60.4
The LCV industry reported robust ~19% growth in 9MFY2018. Going ahead, we
expect growth momentum remain strong.
ALL to launch one product every six months: ALL plans to introduce a new product
every six months to widen offerings and fully harness the demand potential. Further,
3-year price chart
apart from the domestic market, ALL is targeting to capture new export markets (which
160
were earlier restricted due to agreement with MNC partner) as well to tap the growth
140
120
opportunity.
100
Outlook and Valuation: We expect Ashok Leyland to report net Profit (reported) CAGR
80
of ~19% to ~`2,075cr over FY2017-20E mainly due to improvement in replacement
60
40
demand (implementation of vehicle scrappage policy, which opens huge opportunity
20
for ALL). At the CMP of `139, the stock trades at PE of 19.6x its FY2020E EPS of `7.1.
0
We initiate coverage on the stock with a Buy recommendation and Target Price of
`163 based on 23x FY2020E EPS, indicating an upside of ~17% from the current
levels.
Source: Company, Angel Research
Key financials (Standalone)
Y/E March (` cr)
FY2017
FY2018E
FY2019E
FY2020E
Net sales
20,019
26,119
30,728
35,279
% chg
5.7
30.5
17.6
14.8
Net profit
1,491
1,479
1,771
2,075
% chg
92.7
(0.8)
19.8
17.2
Amarjeet S Maurya
EBITDA margin (%)
8.4
10.3
10.3
10.3
022-39357800 Ext: 6831
EPS (`)
5.1
5.1
6.1
7.1
P/E (x)
27.3
27.5
23.0
19.6
P/BV (x)
6.6
5.6
4.7
3.9
RoE (%)
24.3
20.3
20.3
19.8
RoCE (%)
14.0
22.2
23.8
23.9
EV/Sales (x)
2.0
1.5
1.2
1.1
EV/EBITDA (x)
23.3
14.3
12.0
10.2
Source: Company, Angel Research, Note: CMP as of March 6, 2018
Please refer to important disclosures at the end of this report
1
Quick take
Ashok Leyland
Outlook and Valuation
We expect Ashok Leyland to report net Profit (reported) CAGR of ~19% to ~`2,075cr
over FY2017-20E mainly due to improvement in replacement demand (implementation
of vehicle scrappage policy, which opens huge opportunity for ALL). At the CMP of
`139, the stock trades at PE of 19.6x its FY2020E EPS of `7.1. We initiate coverage on
the stock with a Buy recommendation and Target Price of `163 based on 23x FY2020E
EPS, indicating an upside of ~17% from the current levels.
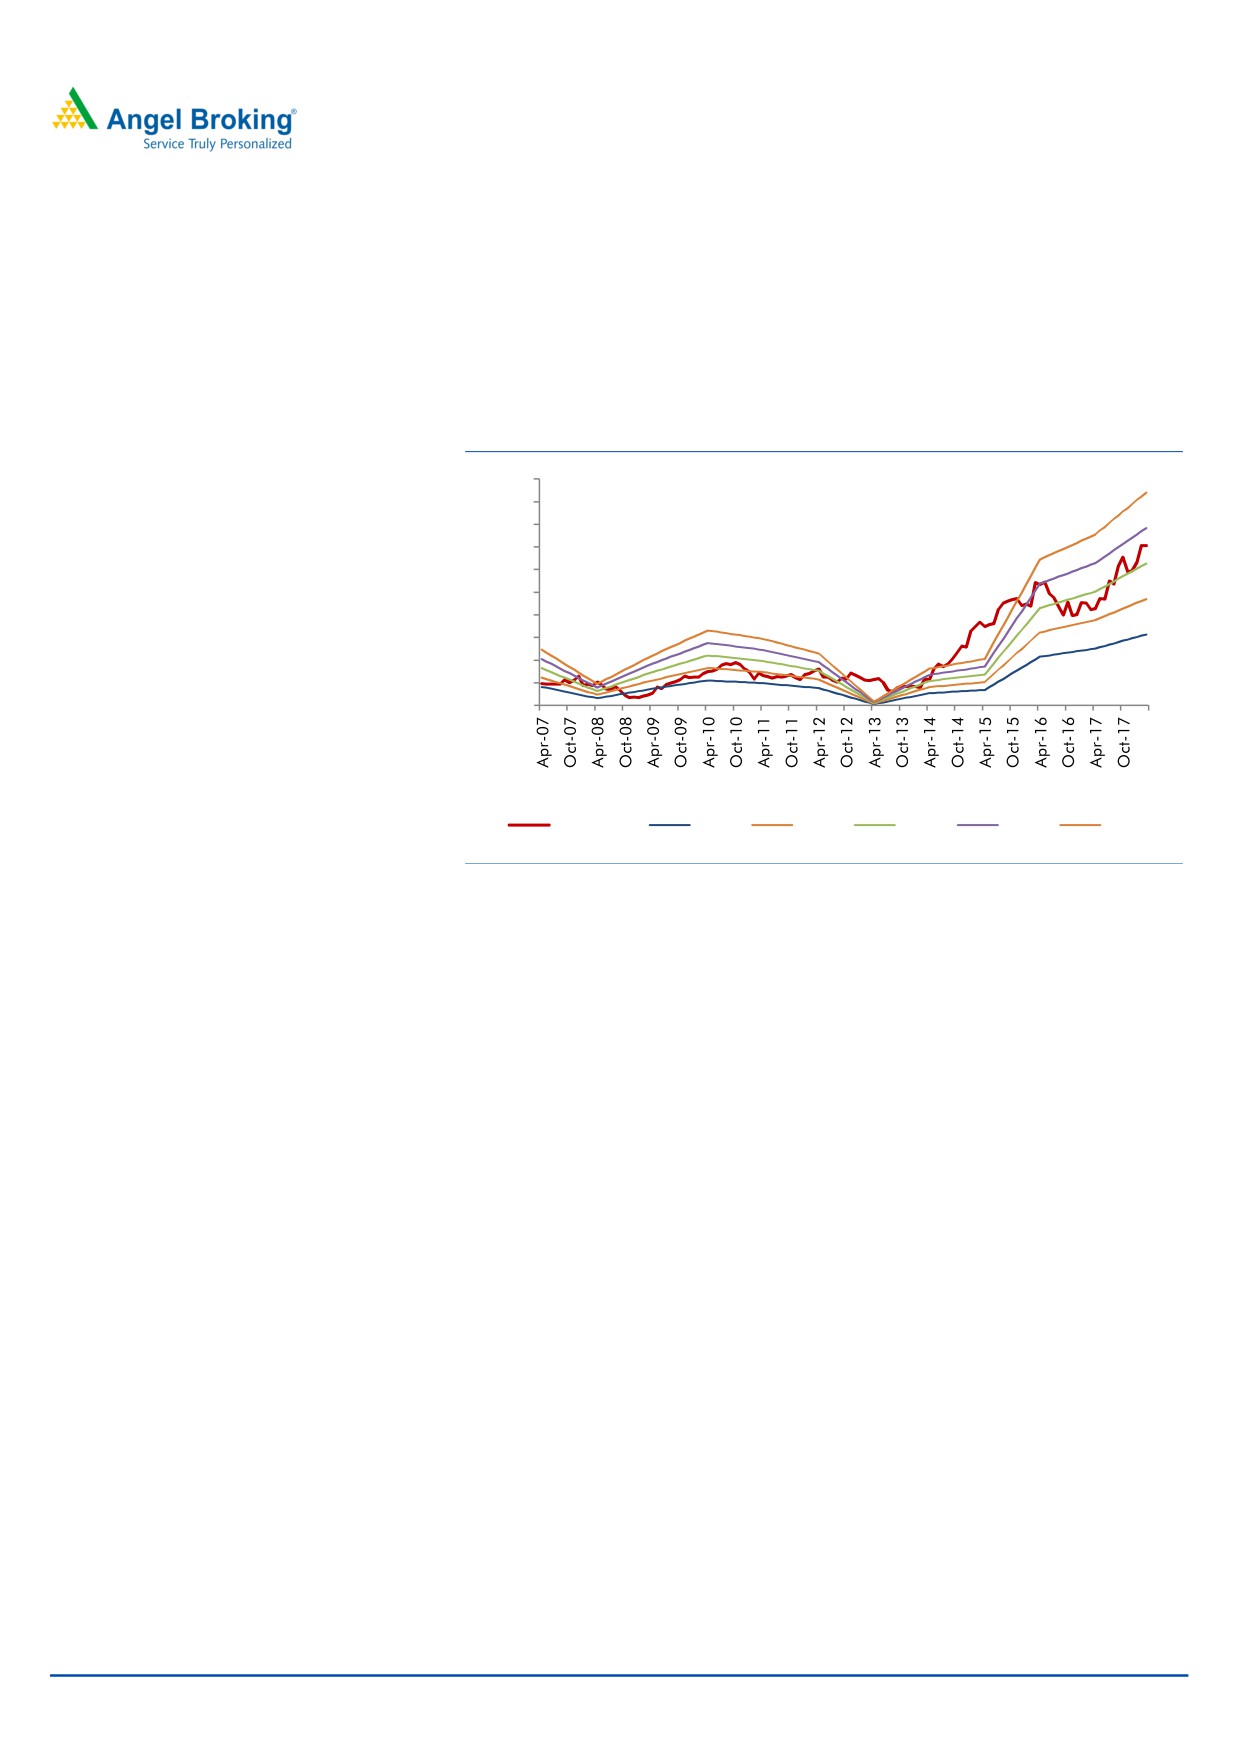
Exhibit 1: One year forward PE Chart
200
180
160
140
120
100
80
60
40
20
0
Share Price
10.0 X
15.0 X
20.0 X
25.0 X
30.0 X
Source: Company, Angel Research
Downside risks to our estimates
Slowdown in industrial activities could restrict sales volume for ALL
Delay in implementation of vehicle scrappage policy could restrict the
additional sales growth for company
March 07, 2018
2
Quick take
Ashok Leyland
Company Background
Ashok Leyland Ltd (ASL) is a holding company. The company is engaged in
commercial vehicles and related components. Through its subsidiaries, it is
engaged in manufacturing and trading in Medium and Heavy Commercial Vehicle
(MHCV), Light Commercial Vehicles (LCV), Passenger Vehicles (PV), automotive
aggregates, vehicle financing and engineering design services. It offers a range of
18 to 80 seater buses under categories such as city application and electric buses.
It offers a range of trucks, which includes long haul trucks, mining and construction
trucks, and distribution trucks. It designs, develops and manufactures defence
vehicles for armed forces. It offers Light Vehicles, which include DOST, PARTNER,
STiLE and MiTR. It offers power solutions for electric power generation, agricultural
harvester combines, earth moving and construction equipment and marine and
other non-automotive applications. It has operations in India, Sri Lanka,
Bangladesh, Mauritius, the Middle East and Africa.
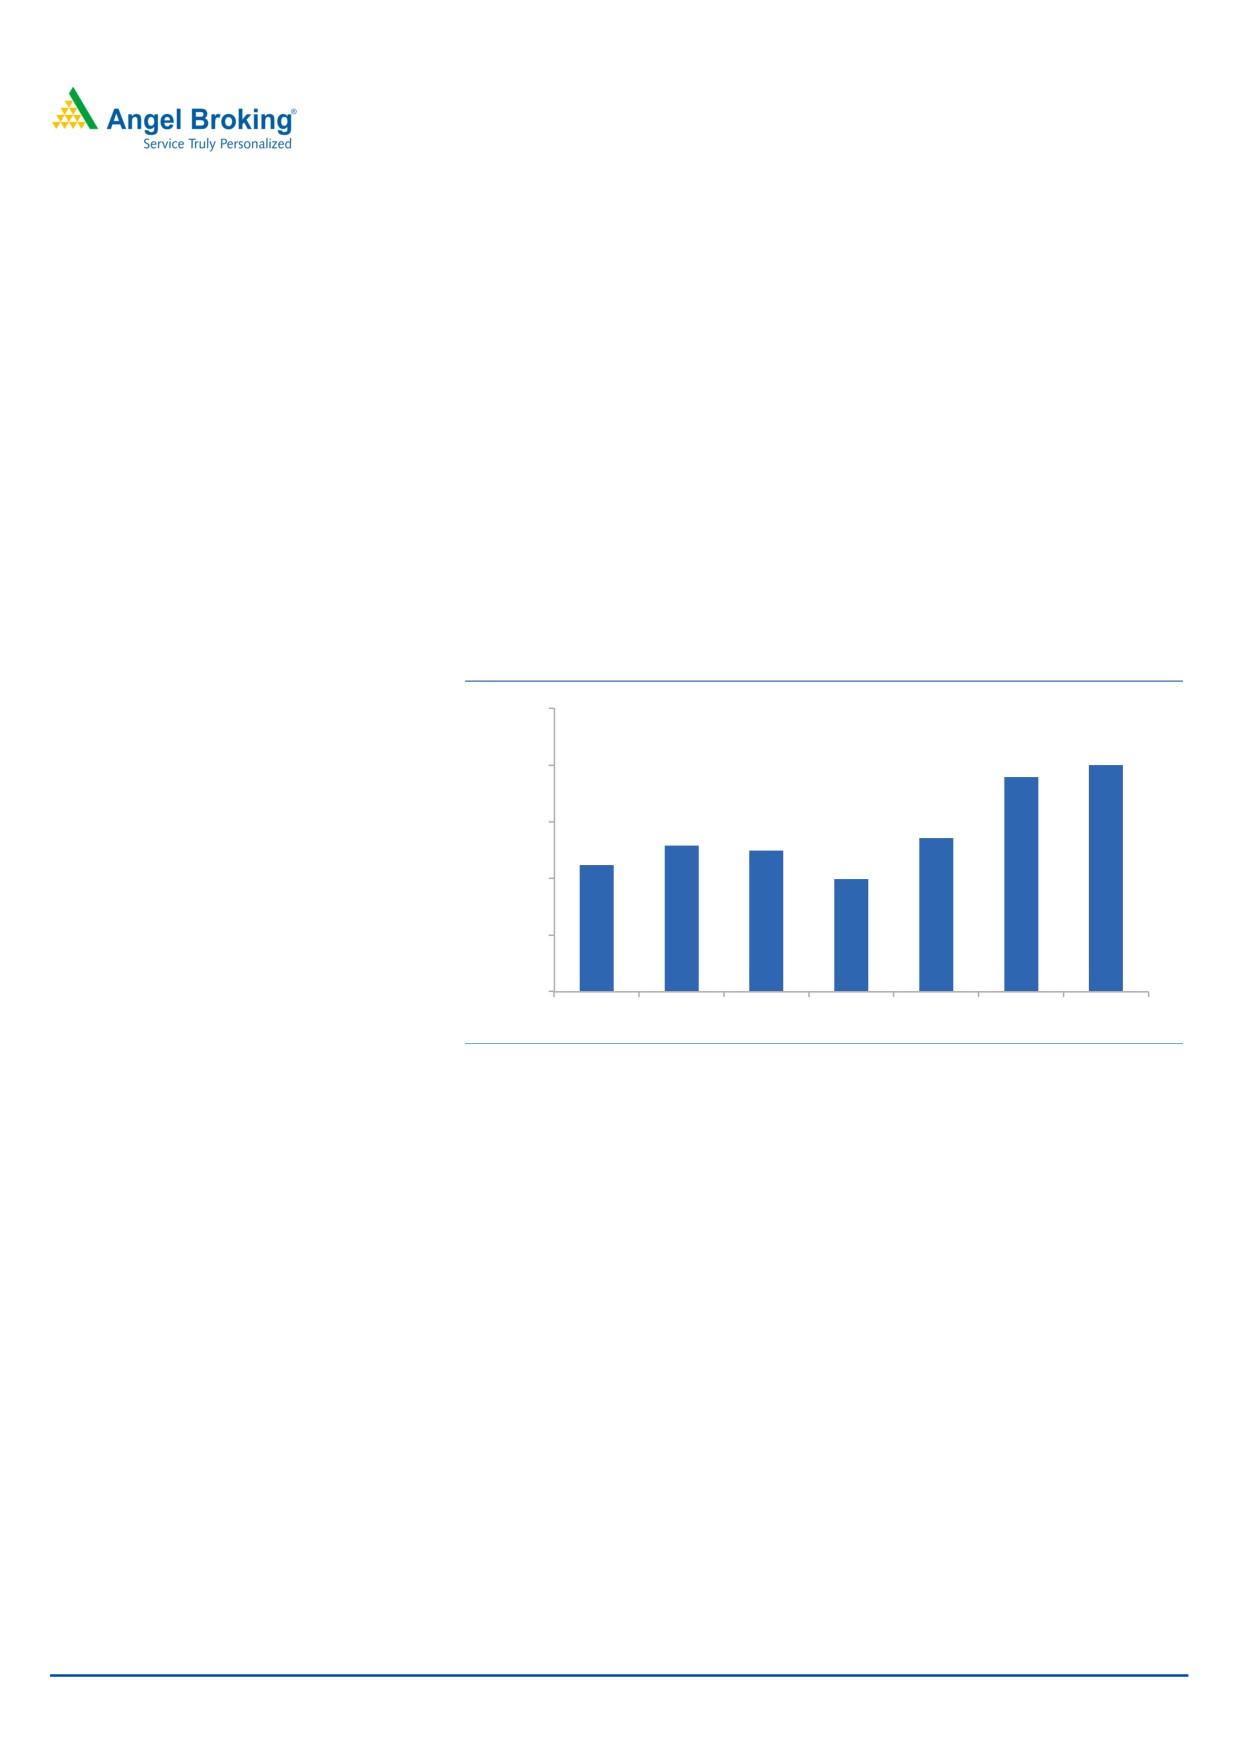
Exhibit 2: Historical CV Volume of ALL
25000
20,019
18,937
20000
15000
13,562
12,904
12,481
11,177
9,943
10000
5000
0
FY2011
FY2012
FY2013
FY2014
FY2015
FY2016
FY2017
Source: Company, Angel Research
March 07, 2018
3
Quick take
Ashok Leyland
Standalone Profit & Loss Statement
Y/E March (` cr)
FY2016
FY2017
FY2018E
FY2019E
FY2020E
Net Sales
18,937
20,019
26,119
30,728
35,279
% chg
39.6
5.7
30.5
17.6
14.8
Total Expenditure
17,498
18,341
23,429
27,563
31,645
Raw Material
13,195
13,973
18,675
21,970
25,225
Personnel
1,385
1,543
2,142
2,520
2,893
Others Expenses
2,918
2,825
2,612
3,073
3,528
EBITDA
1,439
1,677
2,690
3,165
3,634
% chg
79.4
16.5
60.4
17.6
14.8
(% of Net Sales)
7.6
8.4
10.3
10.3
10.3
Depreciation& Amortisation
488
518
573
615
652
EBIT
952
1,160
2,118
2,550
2,982
% chg
146.4
21.9
82.6
20.4
16.9
(% of Net Sales)
5.0
5.8
8.1
8.3
8.5
Interest & other Charges
248
155
154
149
140
Other Income
123
326
165
165
165
(% of PBT)
14.8
24.5
7.8
6.4
5.5
Recurring PBT
827
1,330
2,129
2,567
3,007
% chg
86.9
60.9
60.0
20.6
17.2
Tax
437
107
660
796
932
(% of PBT)
52.9
8.0
31.0
31.0
31.0
PAT (reported)
390
1,223
1,469
1,771
2,075
Extraordinary Items
(384)
(268)
(10)
-
-
ADJ. PAT
774
1,491
1,479
1,771
2,075
% chg
199.5
92.7
(0.8)
19.8
17.2
(% of Net Sales)
4.1
7.4
5.7
5.8
5.9
Basic EPS (`)
2.6
5.1
5.1
6.1
7.1
Fully Diluted EPS (`)
2.6
5.1
5.1
6.1
7.1
% chg
199.5
92.7
(0.8)
19.8
17.2
March 07, 2018
4
Quick take
Ashok Leyland
Standalone Balance Sheet
Y/E March (` cr)
FY2016
FY2017
FY2018E
FY2019E FY2020E
SOURCES OF FUNDS
Equity Share Capital
285
285
285
285
285
Reserves& Surplus
5,123
5,841
6,995
8,441
10,190
Shareholders Funds
5,407
6,126
7,280
8,725
10,475
Total Loans
2,415
2,145
2,250
2,000
2,000
Deferred Tax Liability
753
741
741
741
741
Total Liabilities
8,575
9,012
10,271
11,466
13,216
APPLICATION OF FUNDS
Gross Block
5,279
5,858
6,458
6,758
7,258
Less: Acc. Depreciation
487
887
1,460
2,074
2,726
Net Block
4,792
4,971
4,998
4,684
4,532
Capital Work-in-Progress
76
206
206
206
206
Investments
1,980
2,879
2,879
2,879
2,879
Current Assets
5,925
5,744
8,472
10,727
13,613
Inventories
1,625
2,501
3,506
4,293
5,123
Sundry Debtors
1,251
860
1,360
1,768
2,223
Cash
1,593
912
1,516
1,900
2,740
Loans & Advances
712
709
1,045
1,383
1,764
Other Assets
745
762
1,045
1,383
1,764
Current liabilities
4,623
5,402
6,898
7,643
8,629
Net Current Assets
1,303
342
1,574
3,084
4,985
Deferred Tax Asset
424
614
614
614
614
Mis. Exp. not written off
-
-
-
-
-
Total Assets
8,575
9,012
10,271
11,466
13,216
Source: Company, Angel Research
March 07, 2018
5
Quick take
Ashok Leyland
Standalone Cashflow Statement
Y/E March (` cr)
FY2016
FY2017
FY2018E FY2019E FY2020E
Profit before tax
390
1223
2129
2567
3007
Depreciation
488
518
573
615
652
Change in Working Capital
(179)
190
(627)
(1127)
(1061)
Interest / Dividend (Net)
203
88
0
0
0
Direct taxes paid
(441)
(348)
(660)
(796)
(932)
Others
1223
484
0
0
0
Cash Flow from Operations
1683
2155
1425
1259
1666
(Inc.)/ Dec. in Fixed Assets
34
(366)
(600)
(300)
(500)
(Inc.)/ Dec. in Investments
330
(1111)
0
0
0
Cash Flow from Investing
364
(1477)
(600)
(300)
(500)
Issue of Equity
0
0
0
0
0
Inc./(Dec.) in loans
(789)
(883)
105
(250)
0
Dividend Paid (Incl. Tax)
(154)
(325)
(325)
(325)
(325)
Interest / Dividend (Net)
(263)
(151)
0
0
0
Cash Flow from Financing
(1205)
(1359)
(220)
(575)
(325)
Inc./(Dec.) in Cash
842
(681)
604
383
840
Opening Cash balances
751
1593
912
1516
1900
Closing Cash balances
1593
912
1516
1900
2740
March 07, 2018
6
Quick take
Ashok Leyland
Key ratios
Y/E March
FY2016
FY2017
FY2018E FY2019E FY2020E
Valuation Ratio (x)
P/E (on FDEPS)
52.6
27.3
27.5
23.0
19.6
P/CEPS
46.4
23.4
19.9
17.1
14.9
P/BV
7.5
6.6
5.6
4.7
3.9
Dividend yield (%)
0.4
0.8
0.0
0.0
0.0
EV/Sales
2.1
2.0
1.5
1.2
1.1
EV/EBITDA
27.5
23.3
14.3
12.0
10.2
EV / Total Assets
4.6
4.3
3.8
3.3
2.8
Per Share Data (Rs)
EPS (Basic)
2.6
5.1
5.1
6.1
7.1
EPS (fully diluted)
2.6
5.1
5.1
6.1
7.1
Cash EPS
3.0
5.9
7.0
8.1
9.3
DPS
0.5
1.1
0.0
0.0
0.0
Book Value
18.5
20.9
24.9
29.8
35.8
Returns (%)
ROCE
12.2
14.0
22.2
23.8
23.9
Angel ROIC (Pre-tax)
22.4
25.9
41.2
42.9
43.5
ROE
14.3
24.3
20.3
20.3
19.8
Turnover ratios (x)
Asset Turnover (Gross Block)
3.6
3.4
4.0
4.5
4.9
Inventory / Sales (days)
31
46
49
51
53
Receivables (days)
24
16
19
21
23
Payables (days)
50
56
53
50
50
Working capital cycle (ex-cash) (days)
6
5
15
22
26
March 07, 2018
7
Quick take
Ashok Leyland
Research Team Tel: 022 - 39357800
DISCLAIMER
Angel Broking Private Limited (hereinafter referred to as “Angel”) is a registered Member of National Stock Exchange of India Limited,
Bombay Stock Exchange Limited and Metropolitan Stock Exchange Limited. It is also registered as a Depository Participant with CDSL
and Portfolio Manager with SEBI. It also has registration with AMFI as a Mutual Fund Distributor. Angel Broking Private Limited is a
registered entity with SEBI for Research Analyst in terms of SEBI (Research Analyst) Regulations, 2014 vide registration number
INH000000164. Angel or its associates has not been debarred/ suspended by SEBI or any other regulatory authority for accessing
/dealing in securities Market. Angel or its associates/analyst has not received any compensation / managed or co-managed public
offering of securities of the company covered by Analyst during the past twelve months.
This document is solely for the personal information of the recipient, and must not be singularly used as the basis of any investment
decision. Nothing in this document should be construed as investment or financial advice. Each recipient of this document should
make such investigations as they deem necessary to arrive at an independent evaluation of an investment in the securities of the
companies referred to in this document (including the merits and risks involved), and should consult their own advisors to determine
the merits and risks of such an investment.
Reports based on technical and derivative analysis center on studying charts of a stock's price movement, outstanding positions and
trading volume, as opposed to focusing on a company's fundamentals and, as such, may not match with a report on a company's
fundamentals. Investors are advised to refer the Fundamental and Technical Research Reports available on our website to evaluate the
contrary view, if any.
The information in this document has been printed on the basis of publicly available information, internal data and other reliable
sources believed to be true, but we do not represent that it is accurate or complete and it should not be relied on as such, as this
document is for general guidance only. Angel Broking Pvt. Limited or any of its affiliates/ group companies shall not be in any way
responsible for any loss or damage that may arise to any person from any inadvertent error in the information contained in this report.
Angel Broking Pvt. Limited has not independently verified all the information contained within this document. Accordingly, we cannot
testify, nor make any representation or warranty, express or implied, to the accuracy, contents or data contained within this document.
While Angel Broking Pvt. Limited endeavors to update on a reasonable basis the information discussed in this material, there may be
regulatory, compliance, or other reasons that prevent us from doing so.
This document is being supplied to you solely for your information, and its contents, information or data may not be reproduced,
redistributed or passed on, directly or indirectly.
Neither Angel Broking Pvt. Limited, nor its directors, employees or affiliates shall be liable for any loss or damage that may arise from
or in connection with the use of this information.
Disclosure of Interest Statement
Ashok Leyland
1. Financial interest of research analyst or Angel or his Associate or his relative
No
2. Ownership of 1% or more of the stock by research analyst or Angel or associates or relatives
No
3. Served as an officer, director or employee of the company covered under Research
No
4. Broking relationship with company covered under Research
No
Ratings (Based on expected returns
Buy (> 15%)
Accumulate (5% to 15%)
Neutral (-5 to 5%)
over 12 months investment period):
Reduce (-5% to -15%)
Sell (< -15)
March 07, 2018
8